L o a d i n g

Product Listing & Detail Page Redesign Case Study

Category
Digital Design
Customer
Dealer Auction
Tools
Figma, Figjam, Hotjar, GA
Location
Manchester/ UK

The Challenge

The existing product listing and detail page was hindering user engagement and conversion rates in a competitive trade auction marketplace

Low Conversion Rate

Only 2.3% of visitors were completing auction bids, well below industry standards of 4-6%

Poor Engagement

High bounce rate of 67% and average session duration of only 1.2 minutes

User Frustration

User feedback revealed difficulties in finding relevant vehicles and understanding auction details

Design Process

Define

Identified key user pain points and business objectives

Ideate

Brainstormed solutions with stakeholders and users

Prototype

Created wireframes and interactive prototypes

Test

Validated designs through user testing and iteration

User Personas

Marcus Thompson
Independent Car Dealer
Demographics

45 years old, Birmingham
15 years in car trade

Goals

• Find quality stock at competitive prices
• Assess to vehicle condition and history
• Manage multiple bids efficiently

Pain Points

• Difficulty filtering by specific criteria
• Missing auction end times
• Unclear reserve status

Rebecca Shaw
Fleet Manager
Demographics

38 years old, London
Major rental company

Goals

• Sell fleet vehicles at optimal prices
• Monitor auction performance
• Minimize time to sale

Pain Points

• Lack of bid tracking visibility
• No performance analytics
• Difficult to set competitive reserves

David Chen
Trade Buyer
Demographics

52 years old, Liverpool
Wholesale operation

Goals

• Buy vehicles in bulk at auction
• Track market trends and pricing
• Access detailed vehicle histories

Pain Points

• Can't save search preferences
• No bulk bidding options
• Limited vehicle detail information

Research & Discovery

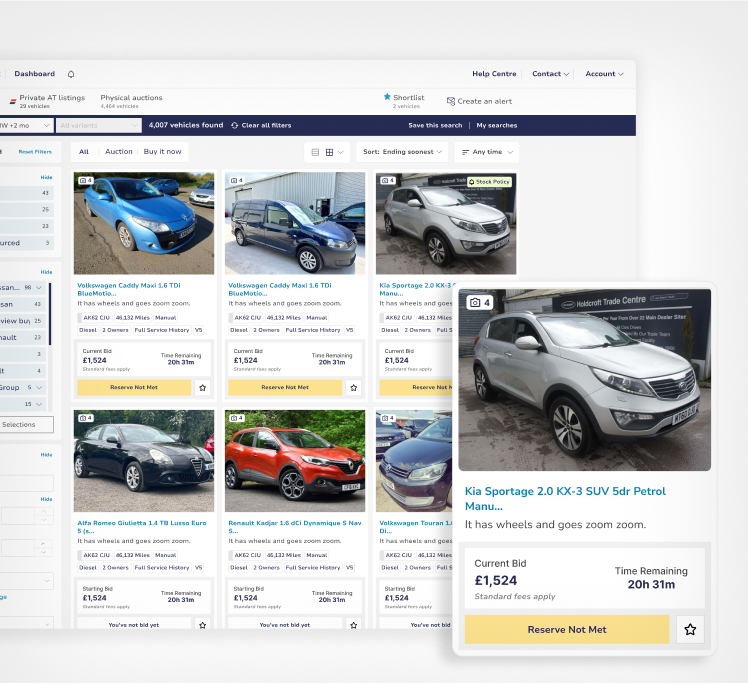
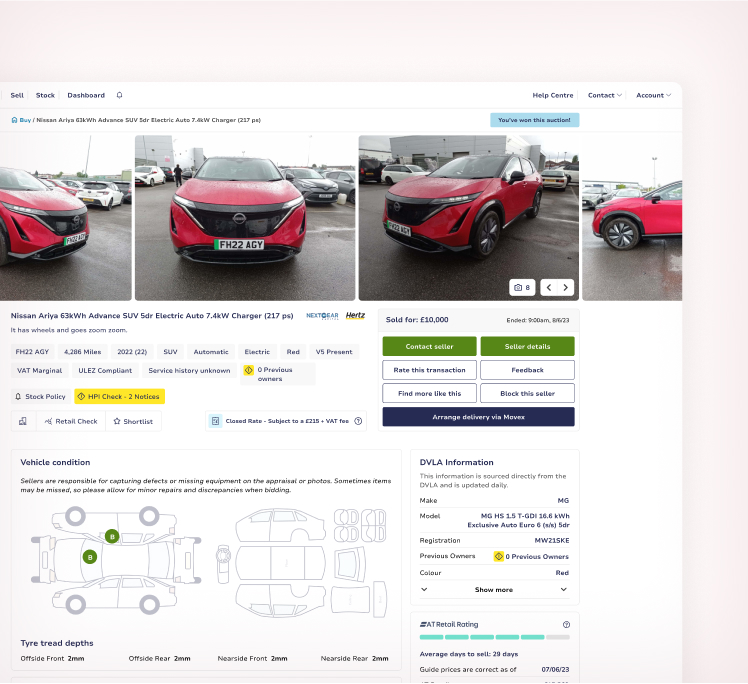
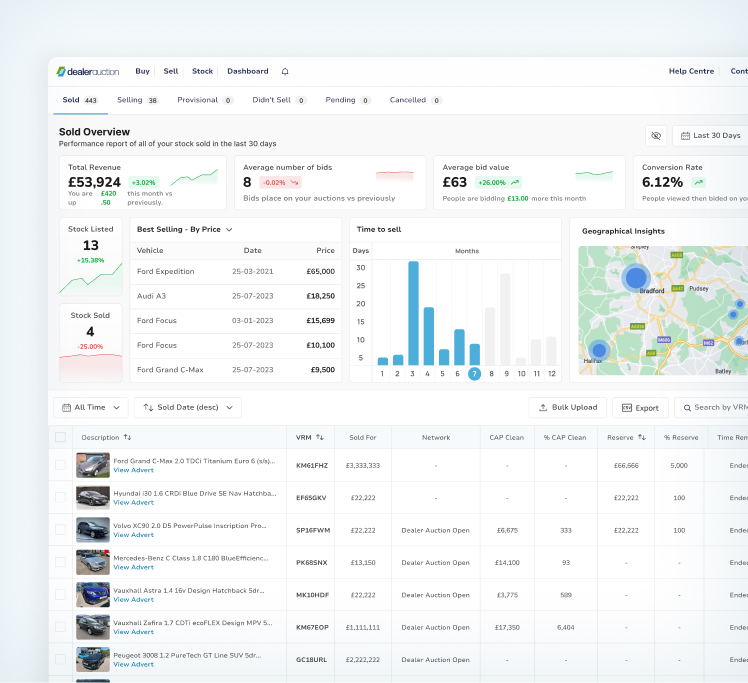
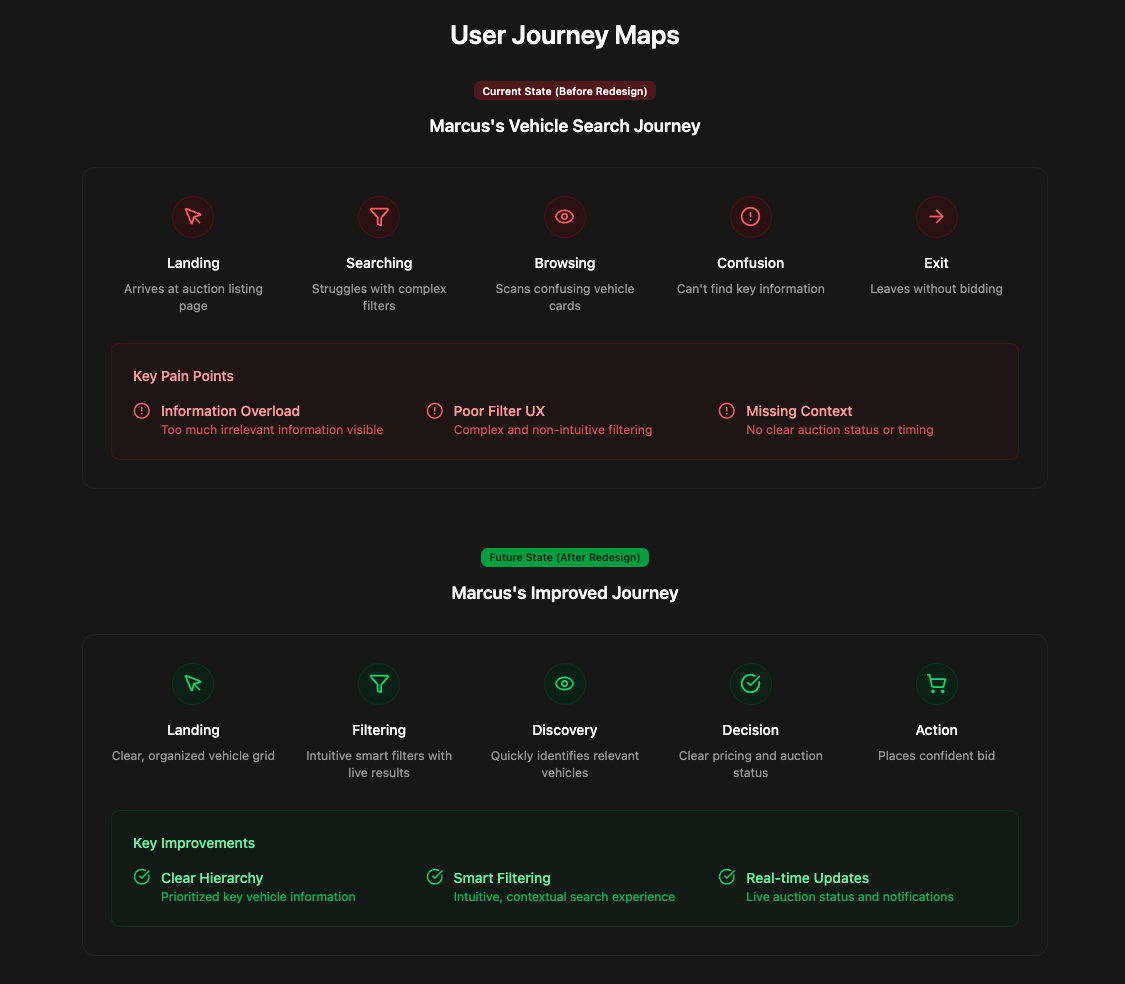
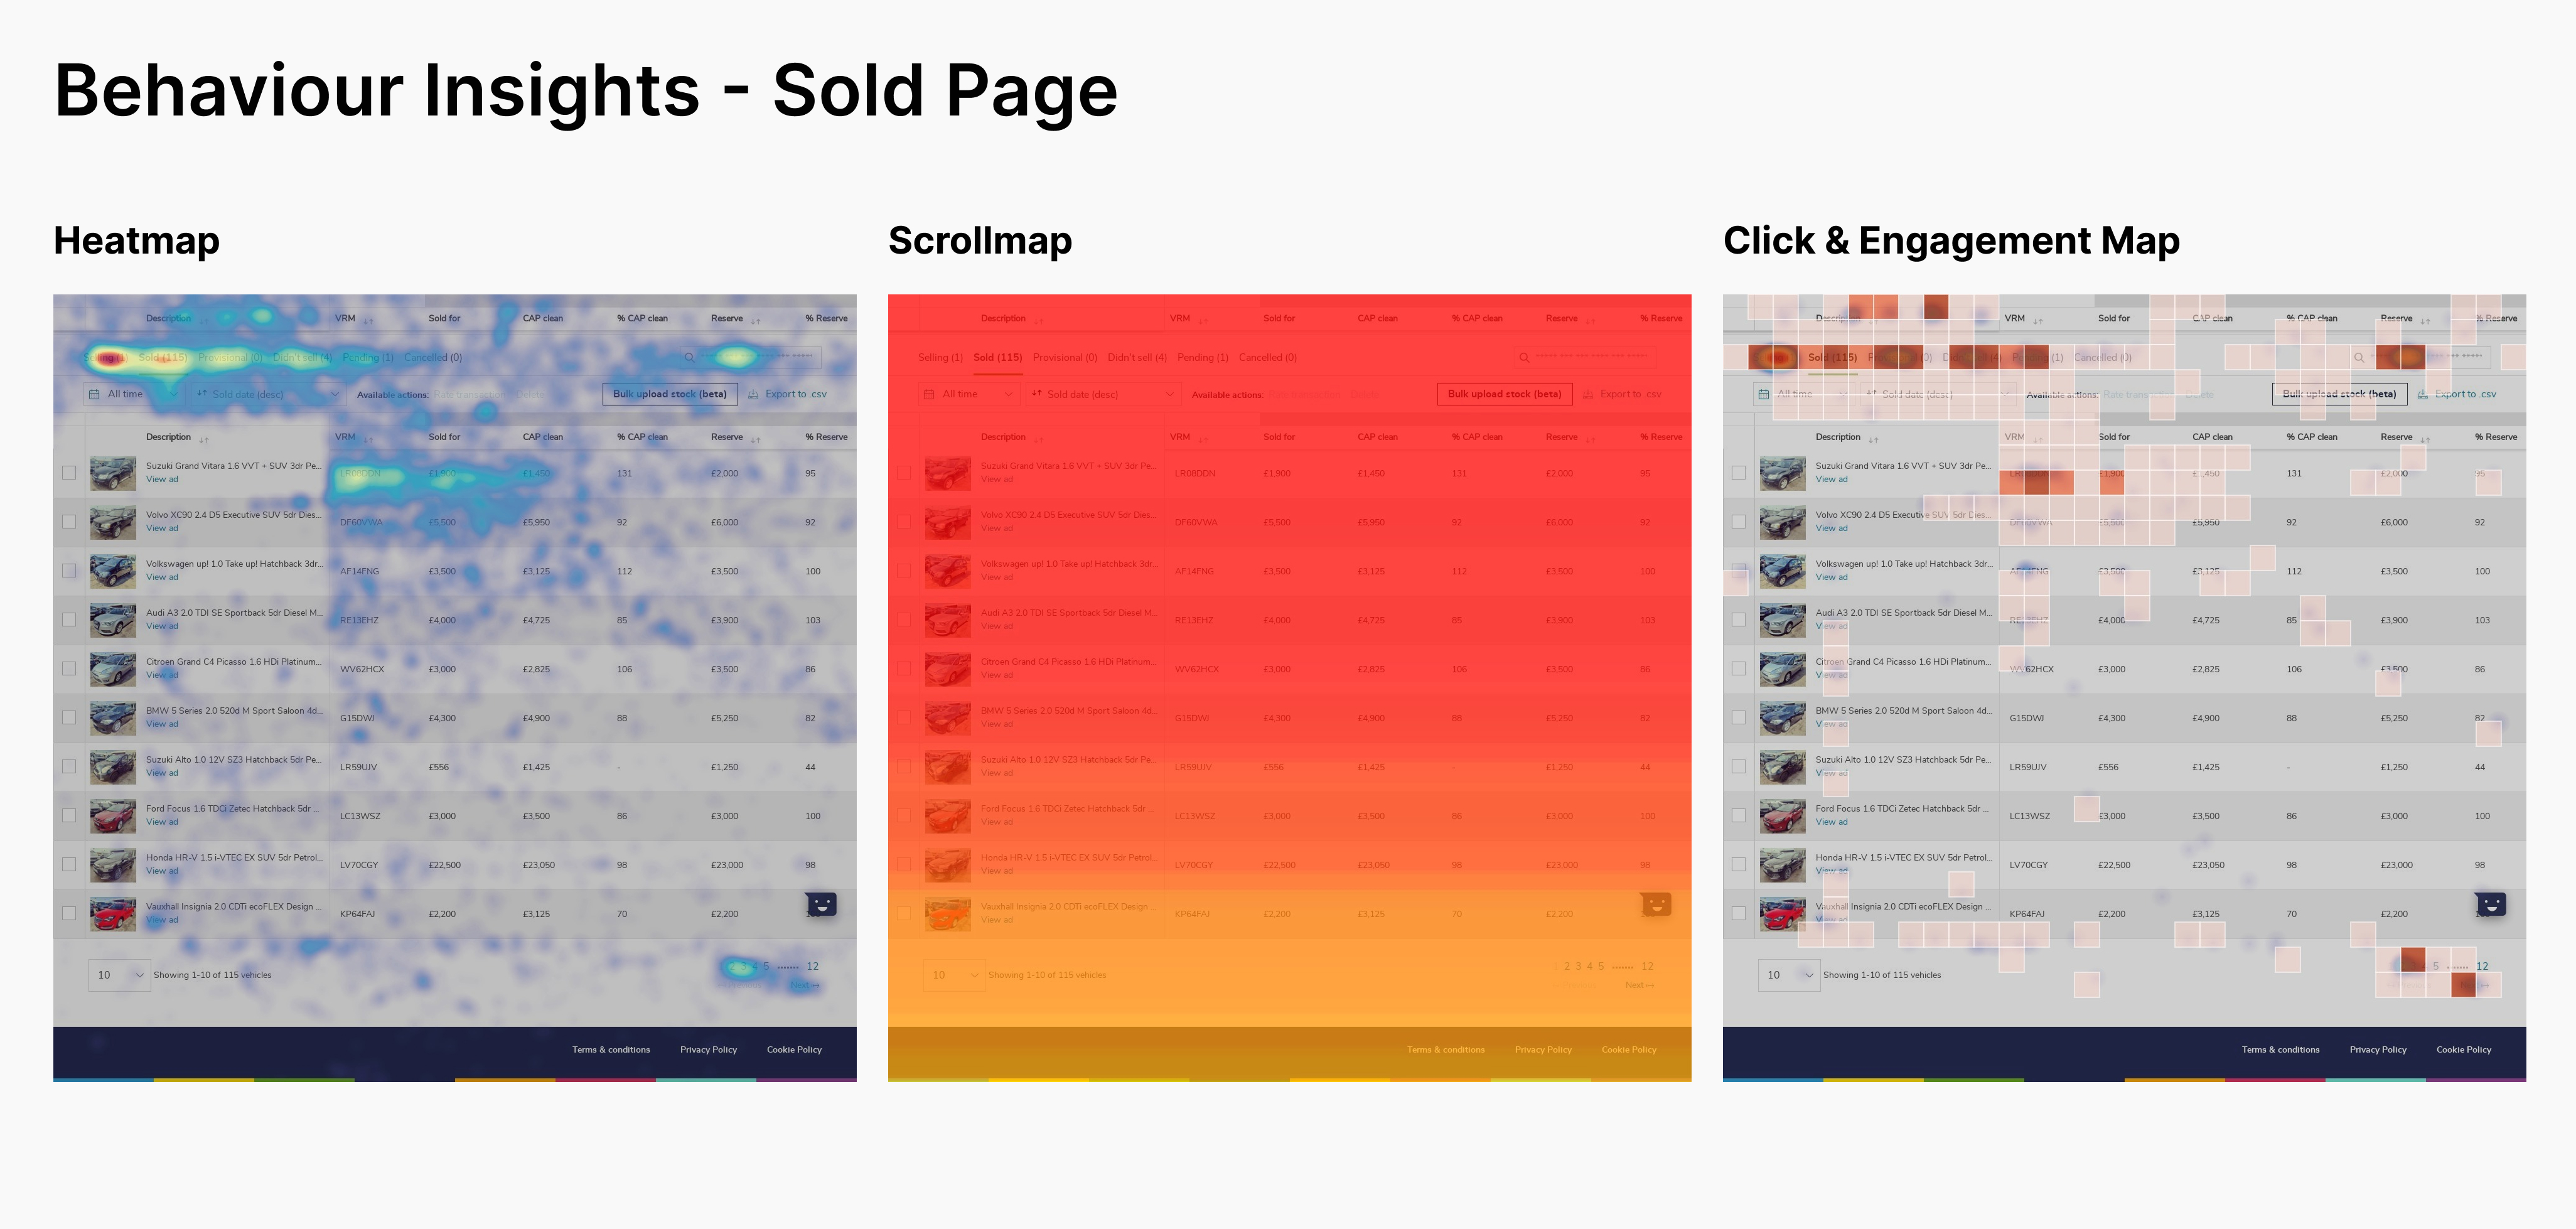
User Research Insights
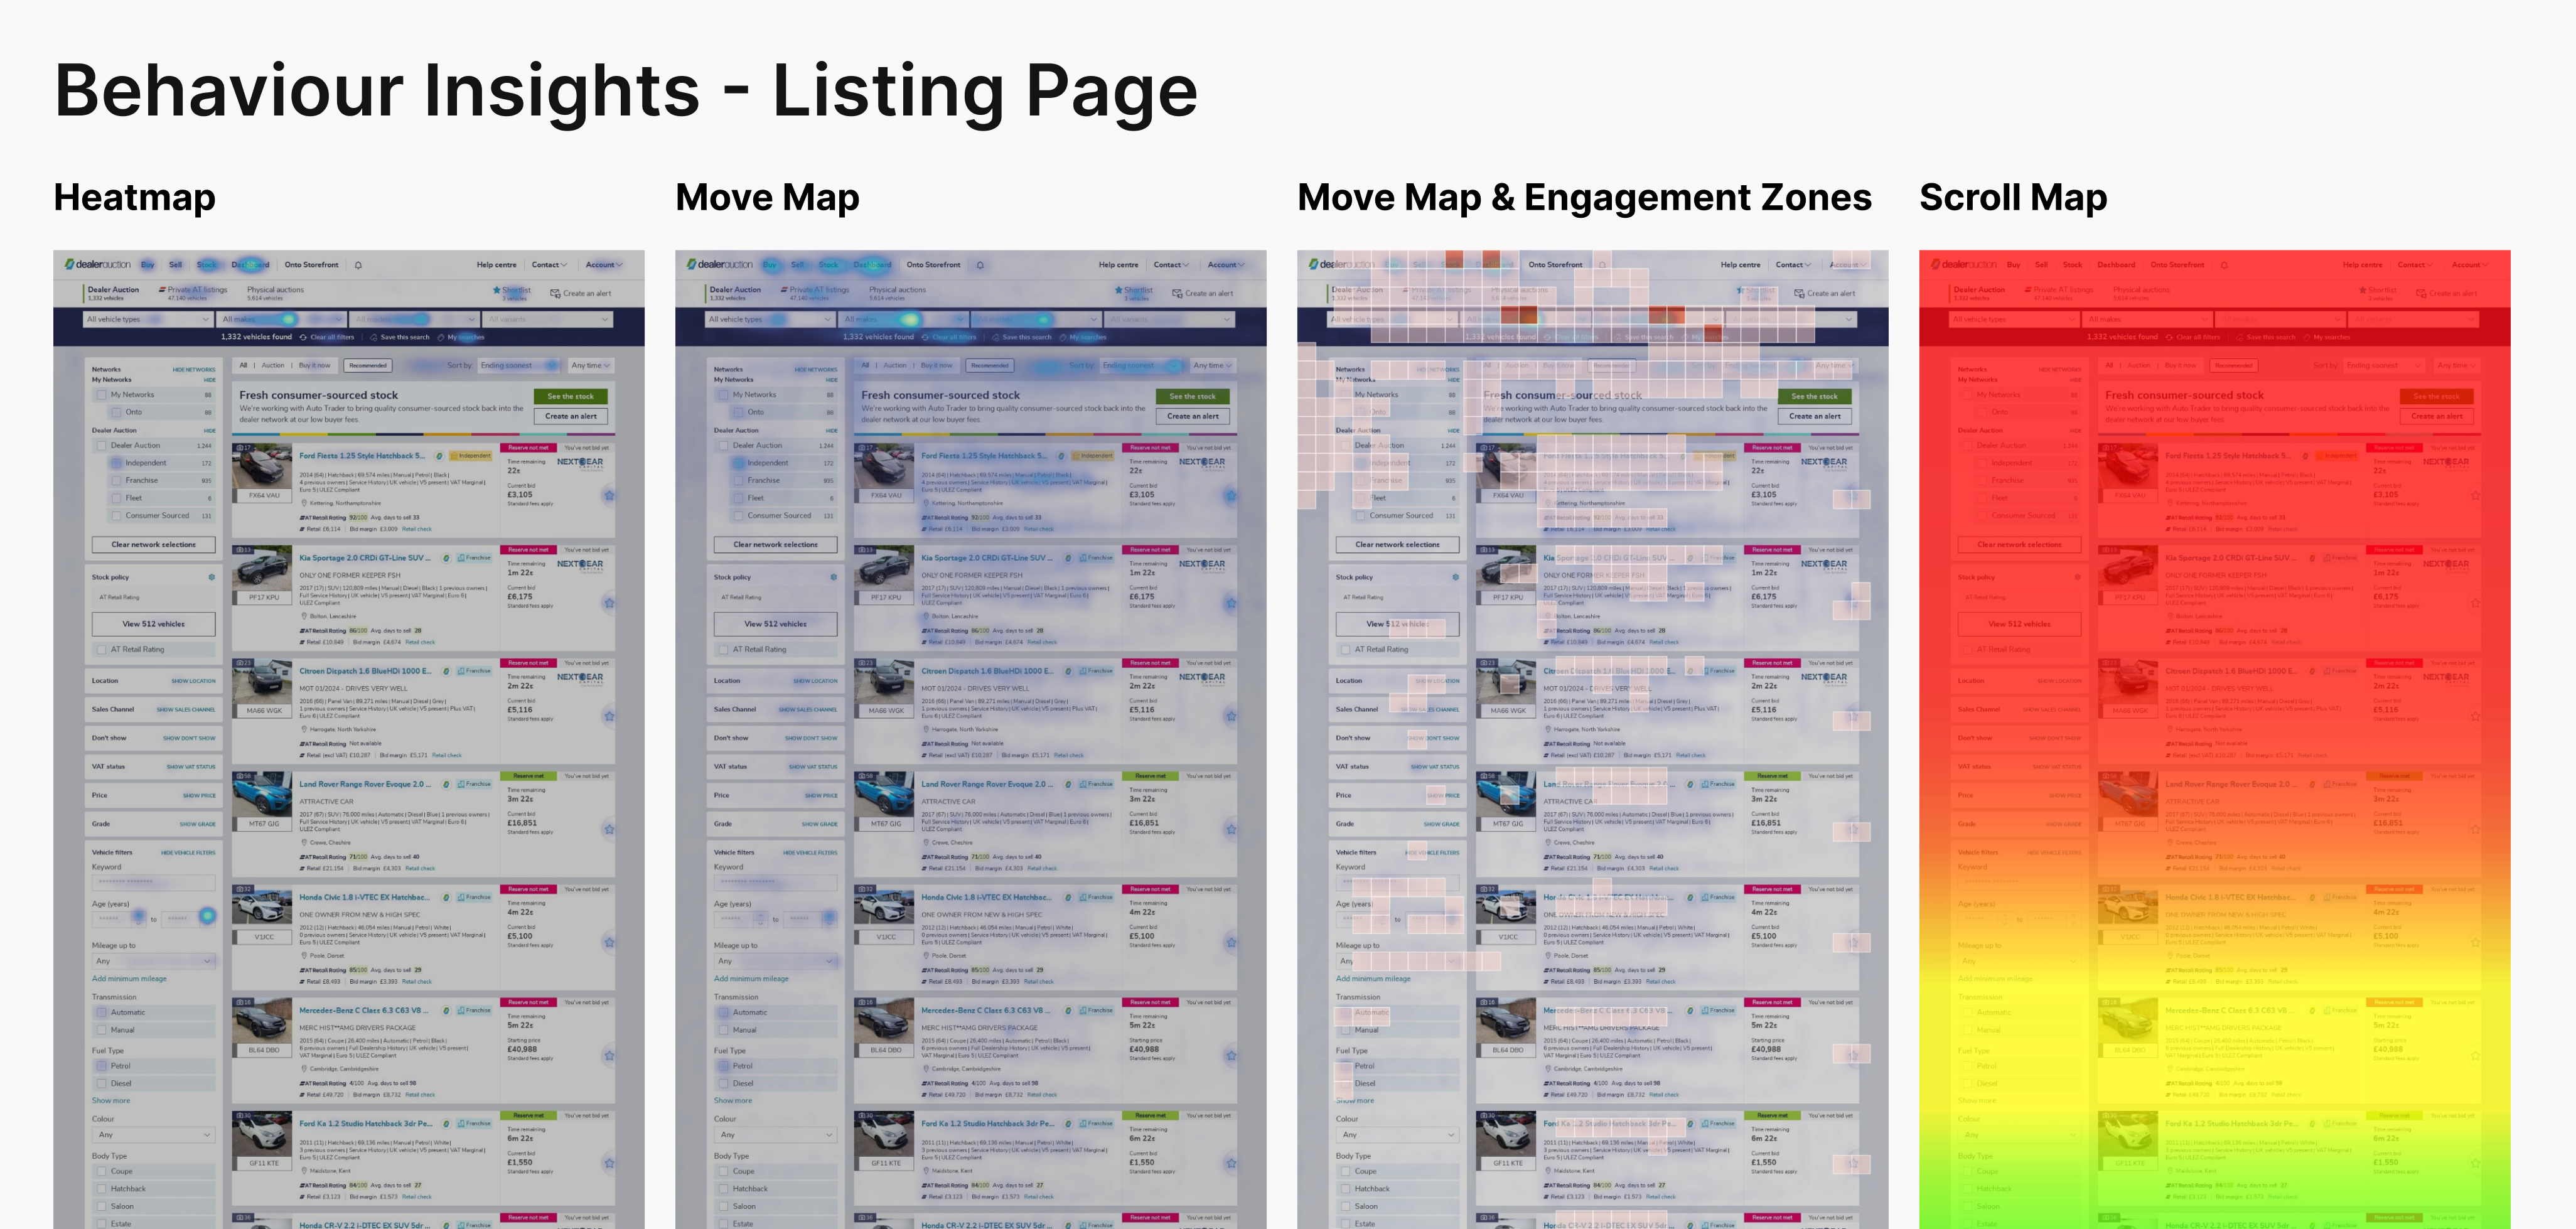
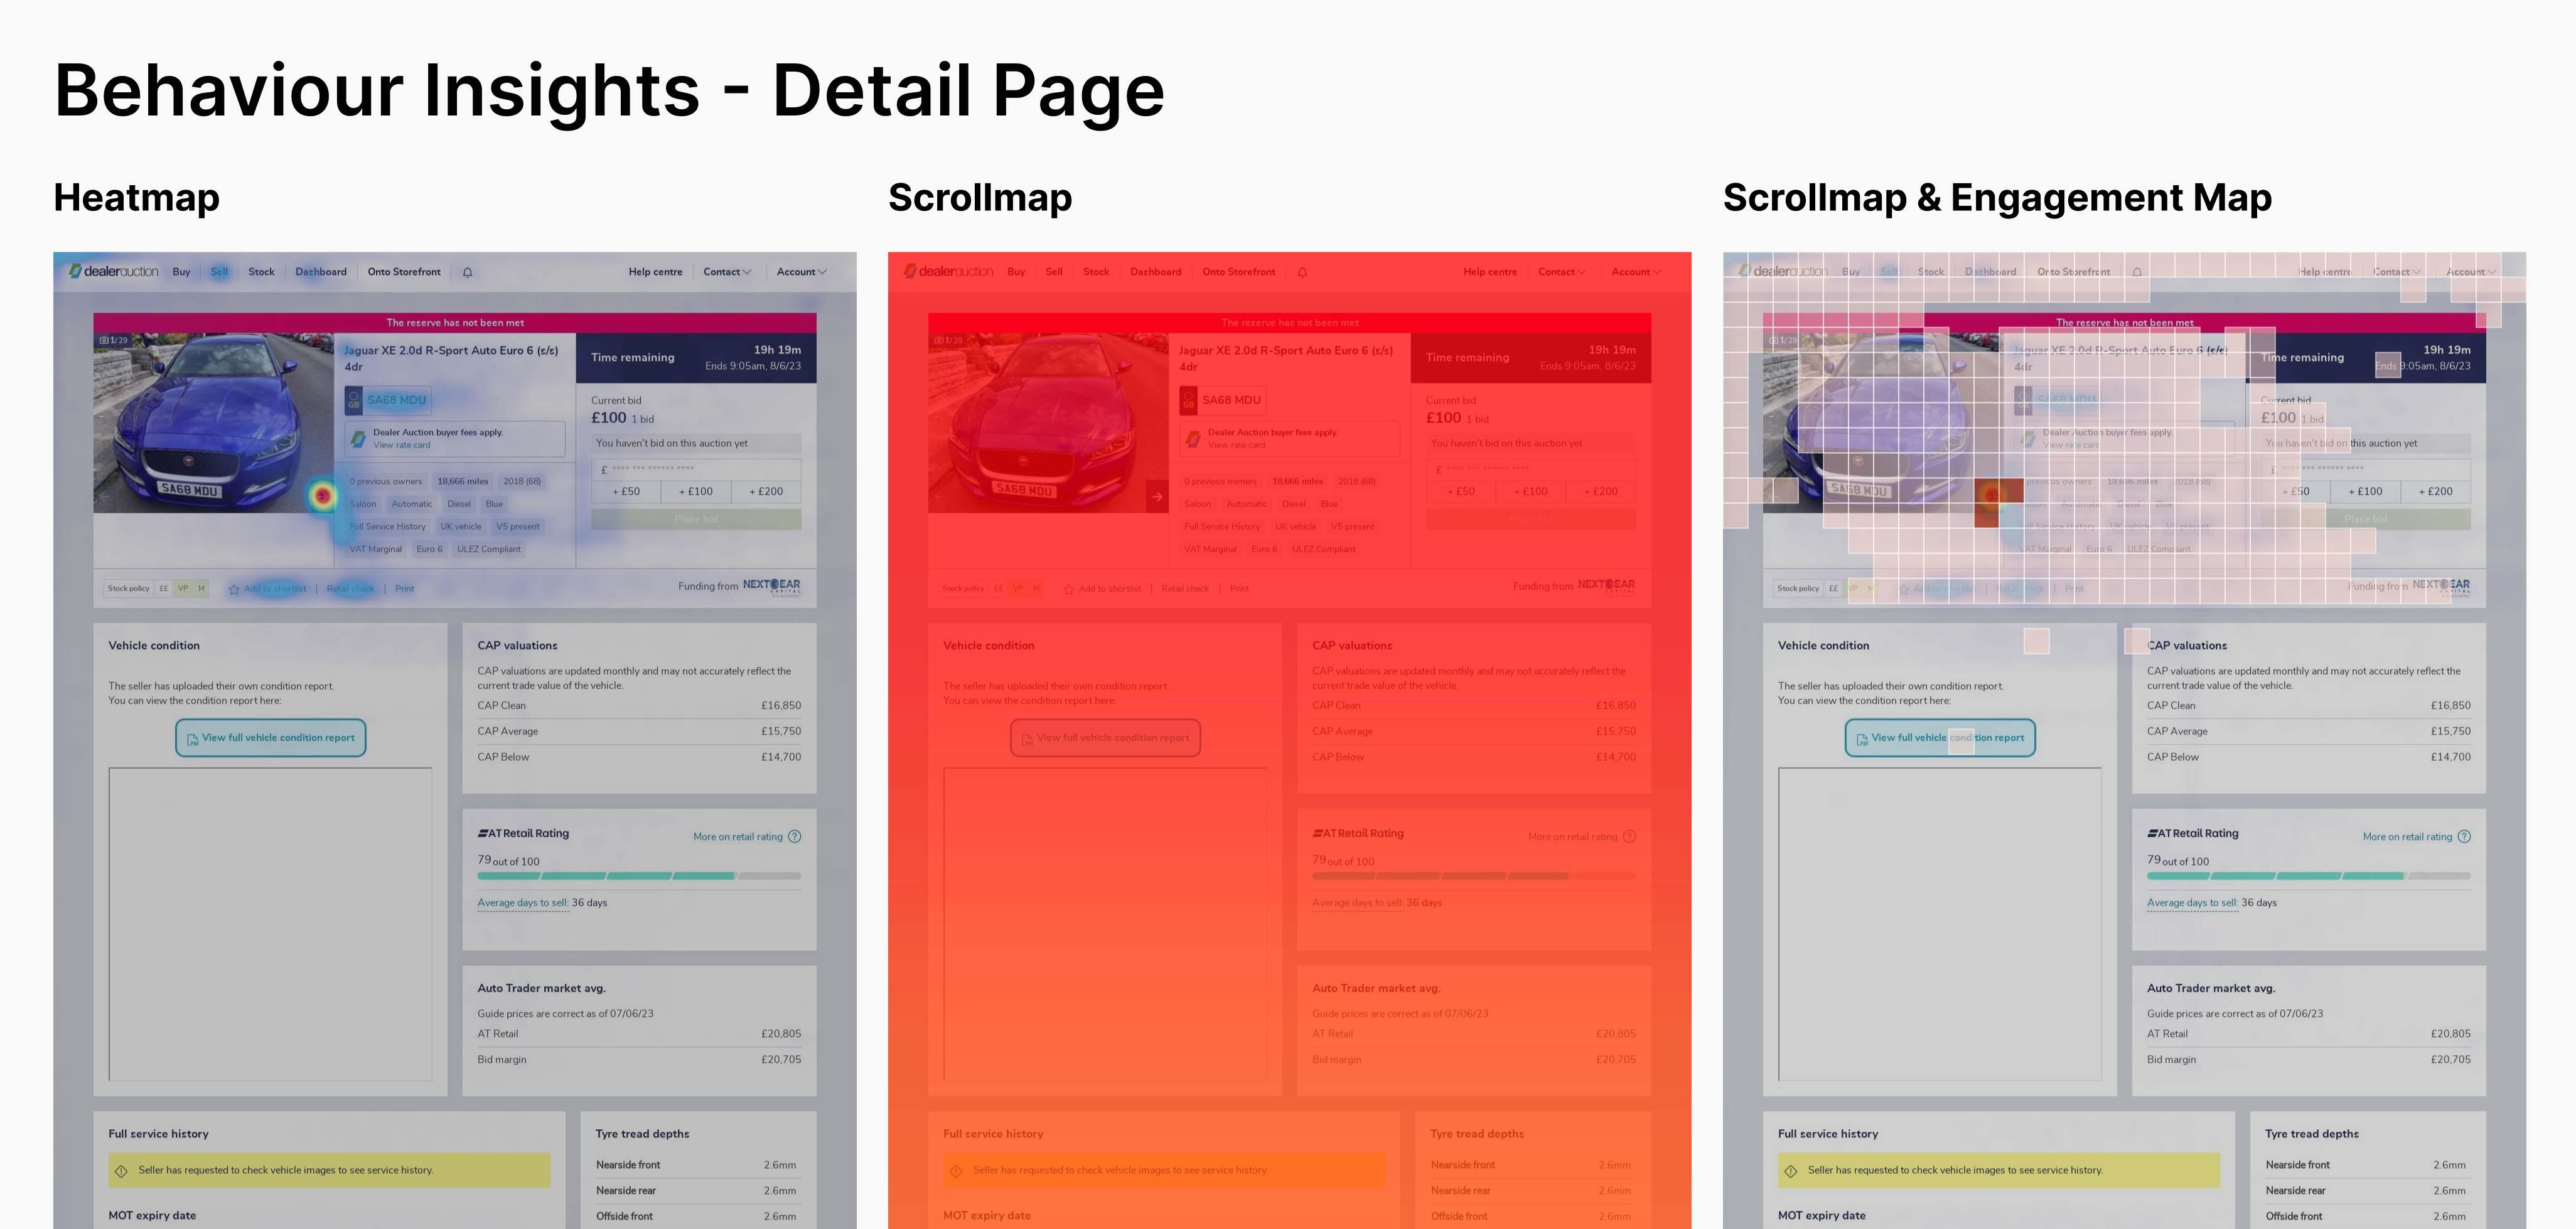
Information Hierarchy Issues

73% of users couldn't quickly identify key vehicle information like price, condition, and auction end time

Filter & Search Problems

Users spent an average of 3.2 minutes trying to find specific vehicles due to poor filtering UX

Trust & Credibility

Lack of visual indicators for vehicle condition and auction status created uncertainty among bidders

Competitive Analysis
Key Findings
  • Leading platforms use prominent visual hierarchy for pricing         and auction status
  • Advanced filtering with saved search functionality increases         user retention
  • High-quality images with zoom capabilities significantly         impact conversion
  • Real-time notifications for bid updates create urgency and         engagement
Information Architecture

Enhanced Visual Hierarchy

Redesigned card layout with prominent pricing, clear auction status indicators, and improved typography hierarchy to help users quickly scan and identify relevant vehicles.

  • Clear price and auction time positioning
  • Color-coded reserve status indicators
  • Improved vehicle information badges
  • Flexibility with list and grid view toggle
Full Page Advert

Image Carousel System

Redesigned the Full page Advert with critical focus on vehicle image display. An image carousel system displays a sizable high quality image of the vehicle, giving more room to lay out vehicle information.

  • Nicely ordered high quality vehicle image
  • More real estate for relevant vehicle information
  • Reduce the need to zoom into vehicle focus
Stock Insights

Real-time Stock Analytics

Redesign sellers dashboard adding valuable information on listing status and general stock perfomance, including information on average sale time for thier listings

  • Geographical insights on bidders/buyers
  • Best selling stock breakdown basd on make and model
  • Bidding activity and value breakdown

Results & Impact

+122%
Conversion Rate
  • From 2.3% to 5.1% in 4 weeks post-launch
-43%
Bounce Rate
  • Reduced from 67% to 38% average session time
+156%
User Engagement
  • Average session duration increased to 3.1 minutes

Key Learnings

What Worked Well
  • Early user research validation prevented costly late-stage         changes
  • Iterative testing with real auction data provided accurate         insights
  • Close collaboration with development team ensured feasible         solutions
  • Hotjar behaviour insights revealed critical interaction pain         points
Areas for Improvement
  • Mobile experience needs further optimization for on-the-go         bidding
  • Advanced analytics dashboard for power users is in         development
  • Integration with third-party logistics platforms planned for         Q2
  • More granular onboarding could further improve adoption